All official European Union website addresses are in the europa.eu domain.
See all EU institutions and bodies
An official website of the European Union | How do you know?
Environmental information systems
EN

Purpose of the European Climate Data Explorer
The European Climate Data Explorer (ECDE) in the Climate-ADAPT portal provides access to a growing selection of climate indices from the climate data store (CDS) of the Copernicus climate change service (C3S). The selection of climate indices in the ECDE reflects the priorities of the European Environment Agency (EEA) as well as the data availability from the C3S. The range of indicators in the ECDE will expand as more become available in the CDS.
Contents
Layout of the European Climate Data Explorer
Thematic Route to Data
First choose a sector then select a climate index to “Discover and Explore”.


Hazard Route to Data
An “overview list all indices” button on the European Climate Data Explorer sector selection page brings you to a full list of available climate indices that are grouped into hazard categories. From this overview page you can navigate directly to the “discover” page of a climate index and from there you can “explore” it further.
Navigating the European Climate Data Explorer
Sector Selection
From the Climate Indices sector selection page (Figure 1) you can select a theme for which you would like to find climate information by clicking on the relevant image. This will lead you to the sector’s homepage which contains a list of all the climate indices associated with that sector (Figure 2). A date range is added to each climate index to show you the time period covered by the index data, so you can see whether the index describes historical climate and/or future climate.
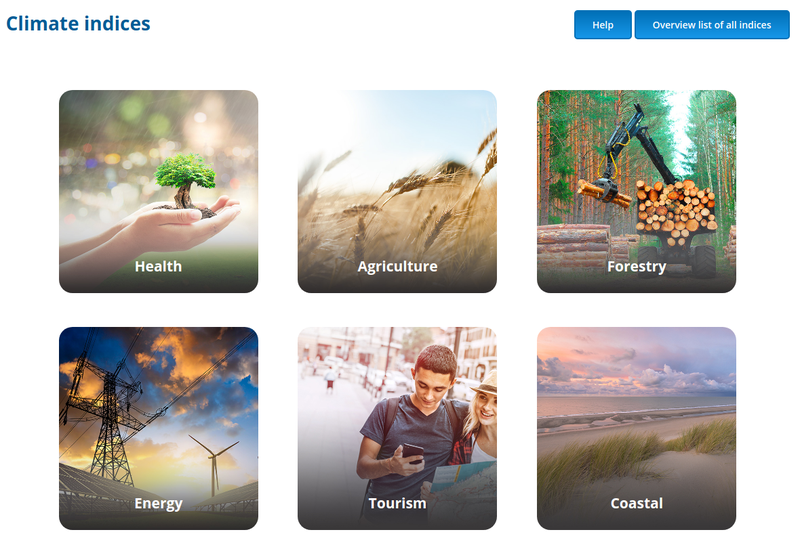
Figure 1: The sector selection page on the European Climate Data Explorer. There are six sectors with indices to explore: Health, Agriculture, Forestry, Energy, Tourism and Coastal.
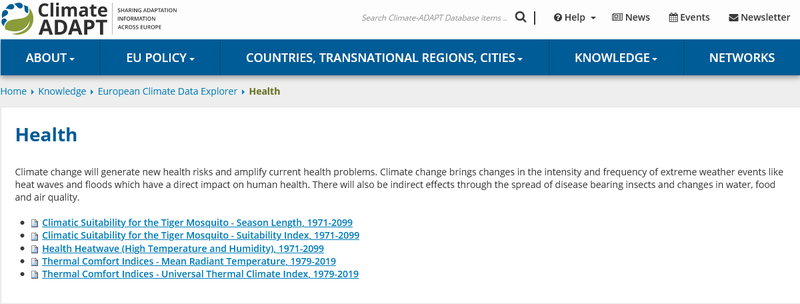
Figure 2: An example of a sector homepage on the European Climate Data Explorer showing the Health sector homepage.
Overview Selection
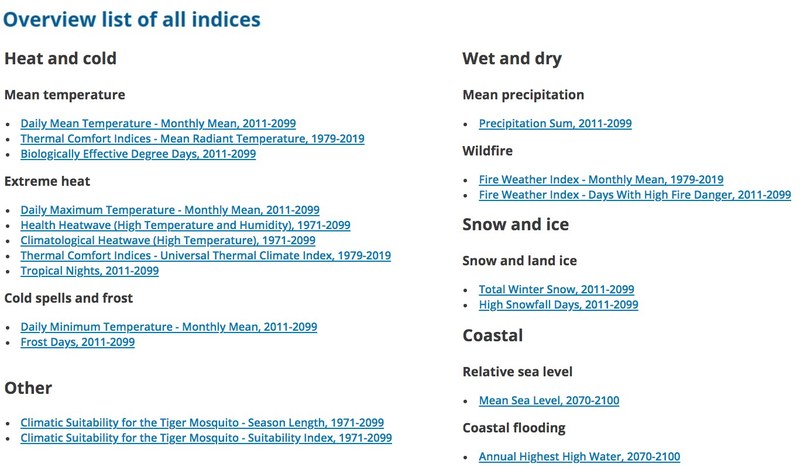
An “overview list all indices” button on the top right of the climate indices sector selection page will lead you to a list of all the climate indices that are available on the European Climate Data Explorer (Figure 3). The indices on the overview page are grouped into hazard categories. From this overview page you can navigate to the “Discover” pages of the climate indices.
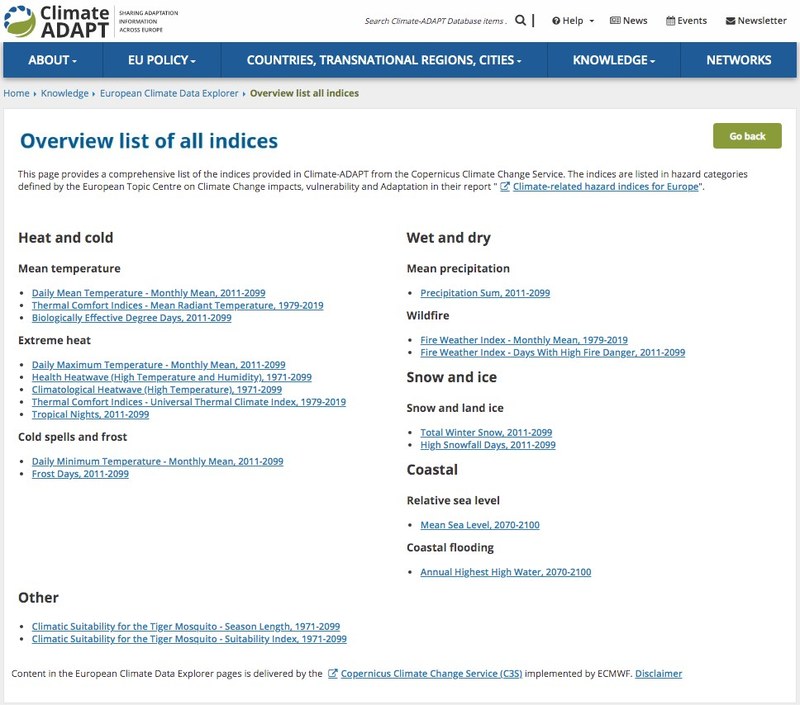
Figure 3: The overview list of all climate indices arranged by hazard category
Climate Index - Discover Page
A climate index link will lead you to the “discover” page for your chosen index.
On the discover page you will see some text about the climate index, and a map displaying the values of that index across Europe.
The text is organised into sections as follows:
- Context: provides information about the index that explains its area of use.
- Definition: describes what the indicator is and how it is calculated.
- Data Sources: describes the data sources that were used to calculate the index.
- Understand: an optional section that describes how the index data values can be understood.
- Supporting Information: provides a link to further information about the index in the climate data store (CDS).
- Visualisation and Navigation: describes the selection options for the data displayed on the map and a summary of what you can find on the “Explore” page of the index.
Beside the map you will find a set of selection options showing the choices available to you for data that can be displayed on the map. A short description of each selection option will appear when you hover your mouse pointer over a selection box. A long description of all the selection options can be found in the “Visualisation and Navigation” section of the page text.
Figure 4 shows an example of a discover page for the Health sector index: “Health Heatwave (High Temperature and Humidity), 1971-2099” which shows the annual number of health-related heatwave days.

Figure 4: An example of a “Discover” page for the Health sector index: “Health Heatwave (High Temperature and Humidity), 1971-2099” which shows the annual number of health-related heatwave days.
Climate Index - Explore Page
The “Explore in detail” button will lead you to the “explore” page for your chosen index.
On the explore page you will see some text about the climate index, and a map displaying the values of that index across Europe.
The text is organised into sections as follows:
- Context: provides information about the index that explains its area of use.
- Definition: describes what the indicator is and how it is calculated.
- Data Sources: describes the data sources that were used to calculate the index.
- Understand: an optional section that describes how the index data values can be understood.
- Supporting Information: provides a link to further information about the index in the climate data store (CDS).
- Visualisation and Navigation: describes the selection options for the data displayed on the map and information about the option to generate a time series plot.
Above the map you will find a set of selection options showing the choices available to you for data that can be displayed on the map. A short description of each selection option will appear when you hover your mouse pointer over a selection box. A long description of all the selection options can be found in the “Visualisation and Navigation” section of the page text.
The data displayed on the map is aggregated into regional area means. The size of the regional aggregation is usually one of the selection options. A Europe-wide area mean is also provided for the EEA member and cooperating countries (EEA 38).
Below the map there is a permanent link to redisplay the explore page with the map configured to your chosen selection options.
The map also has the following dynamic actions:
- hover your mouse pointer over a region to view the value of the index’s area mean
- click on a region to request a time series plot
- a box will appear on the top right of the map where you can choose to generate a time series plot for the region you clicked or for Europe (EEA 38)
The time series plot for your chosen region will appear to the right of the map,
- hover the mouse pointer over the time series plot to view the index’s data values
- click on the plot to reveal action buttons for features such as “zoom” and “download plot as a png”
- If the index is described as a projected change then a historical reference climatology will be shown below the time series plot.
Data Download
Below the map and below the time series plot are links to download the data that is displayed in the .csv file format which can be opened in most spreadsheet software packages.
A camera icon next to the zoom buttons in the top left corner of the map will take a snapshot image of the map (once implemented) that will download as a .png file (once implemented).
The Map as a Gateway to Data
Figure 5 shows an example of an explore page for the Health sector index: “Health Heatwave (High Temperature and Humidity), 1971-2099” which shows the annual number of health-related heatwave days aggregated to national regions. The screenshot shows the lower part of the page, the text above the Visualisation and Navigation section is the same on both the discover and explore pages of a climate index. In the screenshot, France has been highlighted and the option to select either Europe or France has appeared in the top right of the map. The “Go back” button above the map will return you to the discover page of the climate index.
Figure 6 shows the resulting time series plot for France. The mouse pointer is hovered over the time series showing the value of a data point at the end of the time period. The time series plot shows the centre of a running average from 1971 to 2100 which results in a time series covering the period from 1986 to 2085. The download links can be seen beneath both the map and the time series plot.

Figure 5: An example of an explore page for the Health sector index: “Health Heatwave (High Temperature and Humidity), 1971-2099” which shows the annual number of health-related heatwave days aggregated to national area means.
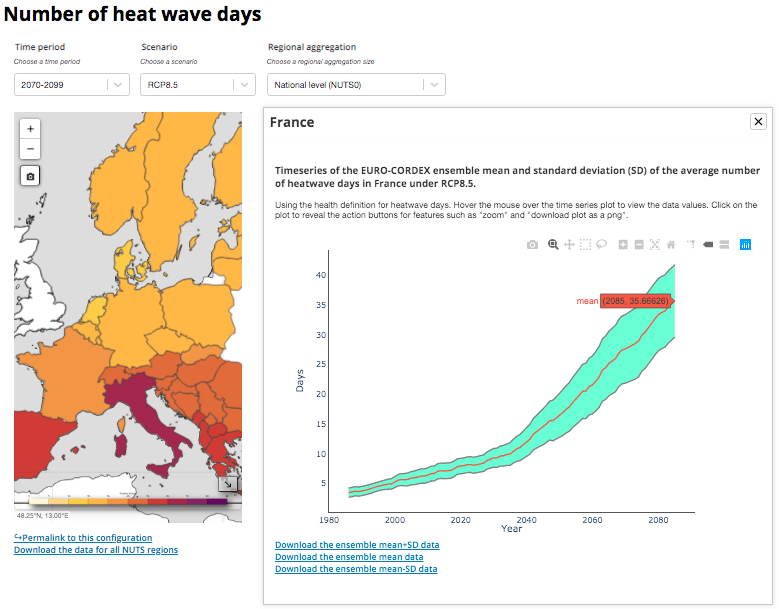
Figure 6: An example of an explore page for the Health sector index: “Health Heatwave (High Temperature and Humidity), 1971-2099” which shows a time series plot for France.
Language preference detected
Do you want to see the page translated into ?
Exclusion of liability
This translation is generated by eTranslation, a machine translation tool provided by the European Commission.
Exclusion of liability
This translation is generated by eTranslation, a machine translation tool provided by the European Commission.