All official European Union website addresses are in the europa.eu domain.
See all EU institutions and bodies
An official website of the European Union | How do you know?
Environmental information systems
EN


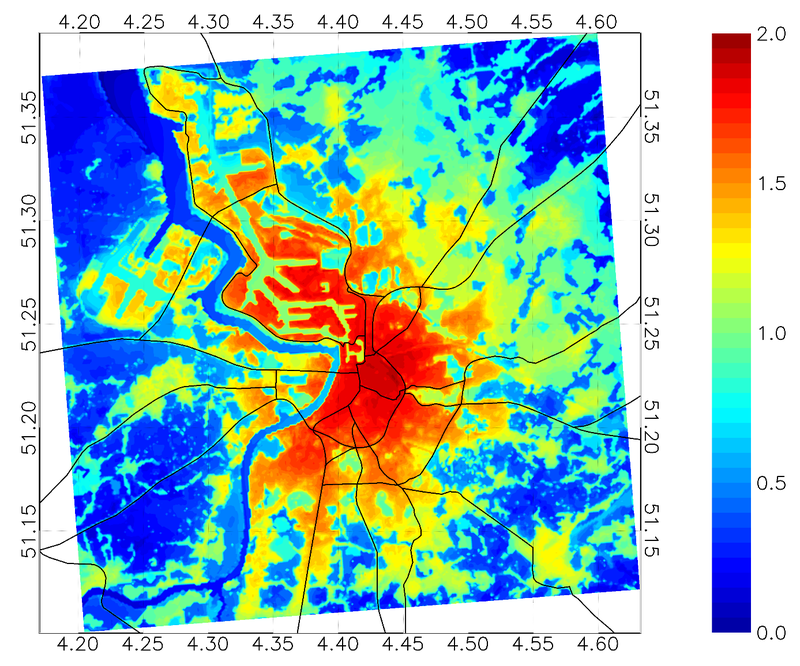
The average urban heat island intensity (in °C) in Antwerp for the period 2008-2017
This map shows the result of VITO’s urban climate UrbClim model for the city of Antwerp and its surroundings. The basis data are hourly 2m air temperature values with a horizontal resolution of 100m. Author: Dirk Lauwaet (VITO). Source: Copernicus Health project. Case study: https://climate-adapt.eea.europa.eu/en/metadata/case-studies/adapting-to-heat-stress-in-antwerp-belgium-based-on-detailed-thermal-mapping
Language preference detected
Do you want to see the page translated into ?
Exclusion of liability
This translation is generated by eTranslation, a machine translation tool provided by the European Commission.
Exclusion of liability
This translation is generated by eTranslation, a machine translation tool provided by the European Commission.