All official European Union website addresses are in the europa.eu domain.
See all EU institutions and bodies
An official website of the European Union | How do you know?
Environmental information systems
EN

Objective(s)
The Social Vulnerability Index tool (SVI-tool) supports users to assess a community’s vulnerability to climate hazards and impacts such as flooding, extreme heat and drought events. The mapped outputs can be used to inform decision-making on climate adaptation and resilience building.
Short description
The tool compiles inhabitant census data for a robust set of social, economic and environmental indicators such as housing quality, unemployment rate, social networks and average education levels (amongst others) to analyse the vulnerability of a given community to climate change. The tool provides an index of socio-economic vulnerability for small areas within a region of interest. This data is visualised by spatial vulnerability high-resolution maps that can be used either alone or in tandem with assessments of bio-physical impacts from climate change. They can also be used for awareness-raising and public engagement with citizens.
Free keywords
Environmental Hazards. Social Vulnerability, Climate Risk, Map
Readiness for use
Applications
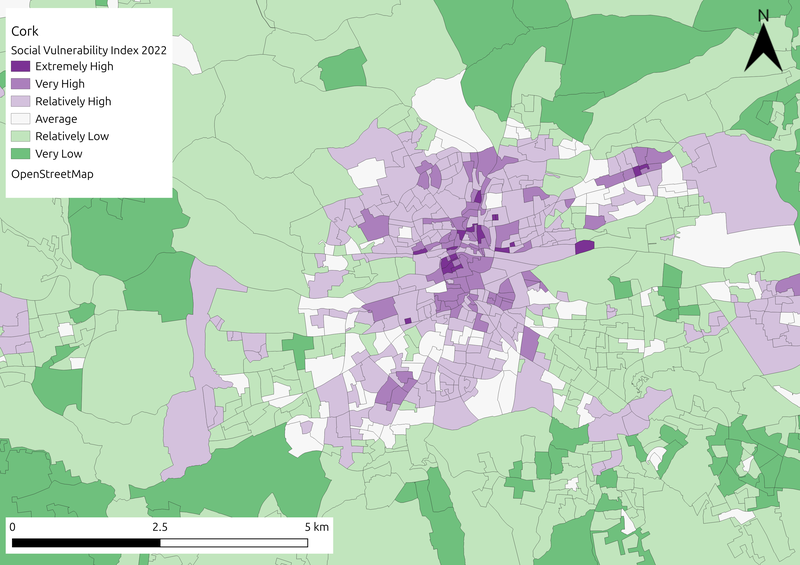
The SVI-tool has been implemented for all regions, provinces and municipalities in Northern Ireland and Ireland, with a focus on Cork City. The tool has also been implemented in the La Rioja region of Spain, including the city of Logroño and Milano in Italy. Data has also been gathered in Rimini in Italy to begin implementation of the tool in this area.
Cork City is using the tool to plan future city adaptation measures and to raise awareness of how climate impacts affect people differently. Logroño is using the tool to plan future city interventions and as an input for the Sustainable Energy and Climate Action Plan (SECAP) to raise awareness among citizens. Derry City and Strabane District Council are using the tool to prioritise future adaptation activity.
Strengths and weaknesses, comparative added value to other similar tools
Strenghts:
(+) The focus on combining indicators of social vulnerability with specific environmental hazards to allow decision makers to prioritise areas of focus with regards to climate adaptation measures.
(+) The tool is completely opensource, with the codes available in GitHub for anyone to utilise or adapt.
(+) The use of national census data which is widely collected and generally freely accessible to all users, allows for comparison of social vulnerability in different regions within a country.
Weaknesses:
(-) Some data may be lacking for some indicators through the national census, especially at a high enough resolution. that will allow for comparisons of vulnerability within city areas, and the assumption that knowledge of the general characteristics of an area will constantly yield accurate and precise information about specific individuals within those areas. However, these are unavoidable when using publicly accessible datasets, and are considered acceptable in an initial approach to assessing social vulnerability.
(-) The tool also requires some familiarity with the GitHub platform and basic coding skills.
The SVI-tool can be used effectively in combination with several other tools to better understand climate change impacts and risks. It is connected to other tools and frameworks through the REACHOUT Triple-A Toolkit. For instance, the Social Vulnerability Index (SVI) data can be incorporated into various other tools in the Triple-A toolkit, including into the damage model layers of the Flood Adapt tool or the Thermal Heat Assessment Tool, as well as used in conjunction with the climate resilient development pathways approach, and with the Crowdsourcing Tool to inform adaptation planning decisions of local government.
When compared to the JRC Vulnerability Dashboard, the resolution of the SVI is much higher than NUTS 3 and SVI offers a greater selection of indicators. Particularly those linked to the different aspects of adaptive capacity, including social networks, tenure and mobility, as well as housing characteristics are included to provide a more robust dataset.
Input(s)
The SVI-tool uses inputs from national census datasets and Copernicus Climate Change Service (C3S) data, both of which are freely accessible and available to users, who can extract the information and include it in the SVI. To add additional indicators and create more detailed outputs, data from regional and local sources may be used. This data is generally held by local authorities and may not be freely available to all users.
Output(s)
The tool outputs maps of the area that are highlighting social vulnerability to a chosen environmental hazard, ranging from extremely high to very low vulnerability. This data is available as shapefiles for the highest resolution available from national census data, for example in Ireland this is the small census area (as shown below).
Replicability: Cost/effort for (new) usage
Users proficient in the coding language R will be able to update and edit the datasets to implement this tool in their chosen area, with the most current information available. We estimate that this should take no more than 2 days of work.
The code to amend this tool is completely open source and available on GitHub, and when completed the user guide will also be freely available.
Materials or other support available
A user guide is being developed (in English, Spanish and Italian) to allow regions to update the tool with additional data as it becomes available to them. Detailed guidance is currently available in English outlining the development of the tool on a dedicated Juypter Notebook Page while a recent publication in MethodsX (McCullagh et al., 2025) outlines the methodology for the development of the SVI tool.
The code to amend this tool is completely open source and available on GitHub.
Website and maintenance
This tool is accessible via GitHub: GitHub - UCC-CLIMPADAP/SVIBook: Master repository for the notebooks to be included in the SVI JupyterBook
It will also be available on the Climate Ireland Website: https://www.climateireland.ie/
And it is also available as part of the Triple-A Toolkit: https://triple-a-toolkit.eu/ providing complementary information on other useful tools that can complement this climate service.
Contact
Denise McCullagh
Denise.mccullagh@ucc.ie
Associated project(s)
This work was primarily supported by the REACHOUT project, which has received funding from the European Union's Horizon 2020 research and innovation program [grant number 101036599]. There was also additional support from the Environmental Protection Agency (EPA) Research Programme 2021–2030, as a part of the TALX2 project [grant number 2023-CE-1227] and the European Union's Horizon 2020 research and innovation program through the Directed project [grant number 101073978].
The SVI-tool will support RAST step 2 and make minor contributions to RAST steps 1 and 4. The tool identifies spatial areas and populations living there that are particularly vulnerable to different climate hazards, specifically flooding and heat hazards. It utilises factors that determine the sensitivity of a population, along with indicators of their adaptive capacity, and combines this with exposure information to determine average vulnerability over a spatial area. This information on vulnerability to climate hazards is central to understanding what adaptation measures are necessary in an area to protect vulnerable populations and ensure equitable action.
The information is provided at various scales, dependant on the available datasets from the location of interest. As the datasets used are national, comparison of different areas can be done at a national scale.
In Ireland the data is provided at the small census area scale for the entire country. This allows specific areas of vulnerability within city regions to be identified.
Geographical area
All Continental, with a focus on urban/populated areas.
Flooding (Pluvial, Fluvial, Coastal)
Extreme heat
The tool is currently available in English, but guidance in Spanish and Italian is being developed.
Not Sector Specific, although urban planning, infrastructure, health and disaster risk reduction sectors could all benefit from this tool.
Local and regional authorities and other decision makers can utilise the tool. Additionally, actors in housing development and management, urban planning, emergency services, and insurance can refer to the tool to complement their usual information systems with additional insights that they can act on. Social science researchers may utilise this tool to better understand vulnerability in different areas.
The tool is an easy-to-use interface which creates maps that can be understood by all users that have basic coding skills to make use of the free codes on GitHub.
However, basic coding skills in R language will be necessary if users wish to adapt the tool to add additional or higher resolution data that is specific to their area.
Disclaimer
The contents and links to third-party items on this Mission webpage are developed by the MIP4Adapt team led by Ricardo, under contract CINEA/2022/OP/0013/SI2.884597 funded by the European Union and do not necessarily reflect those of the European Union, CINEA, or those of the European Environment Agency (EEA) as host of the Climate-ADAPT Platform. Neither the European Union nor CINEA nor the EEA accepts responsibility or liability arising out of or in connection with the information on these pages.
Language preference detected
Do you want to see the page translated into ?
Exclusion of liability
This translation is generated by eTranslation, a machine translation tool provided by the European Commission.
Exclusion of liability
This translation is generated by eTranslation, a machine translation tool provided by the European Commission.