All official European Union website addresses are in the europa.eu domain.
See all EU institutions and bodies
An official website of the European Union | How do you know?
Environmental information systems
EN

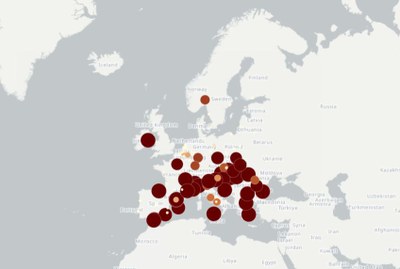
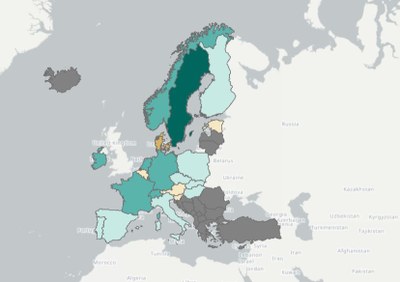
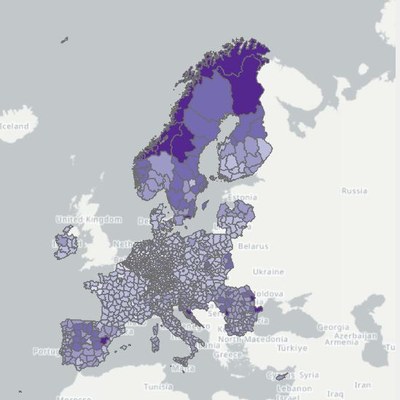
Welcome to the Observatory's data visualisations page, where you can explore interactive maps, charts, dashboards, and infographics that bring climate and health data to life.
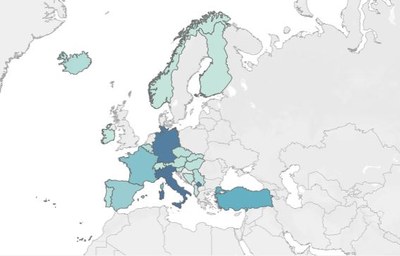
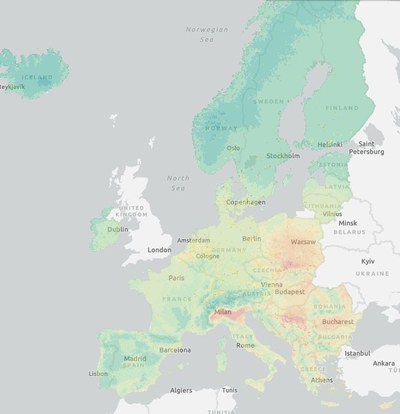
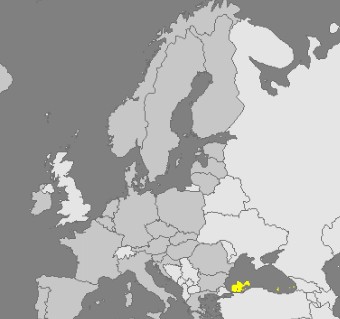
Products from the Observatory

European Climate Health Observatory

European Climate and Health Observatory

European Climate and Health Observatory

European Climate and Health Observatory

European Climate and Health Observatory

European Climate and Health Observatory
European Climate and Health Observatory

European Climate and Health Observatory
European Climate and Health Observatory
European Climate and Health Observatory
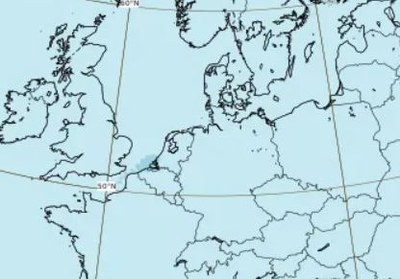
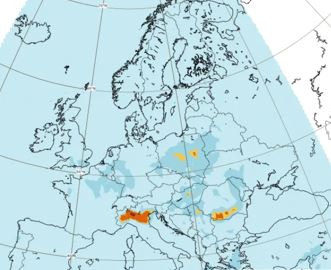
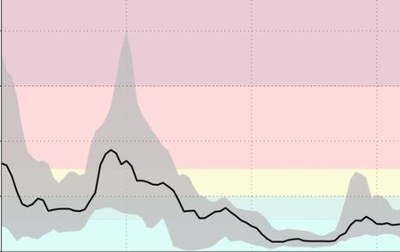
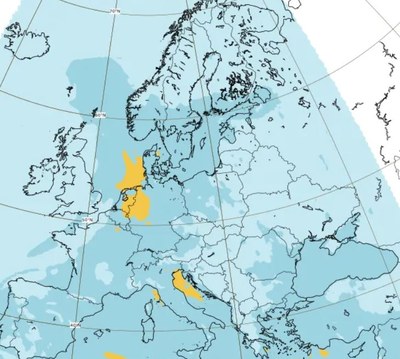
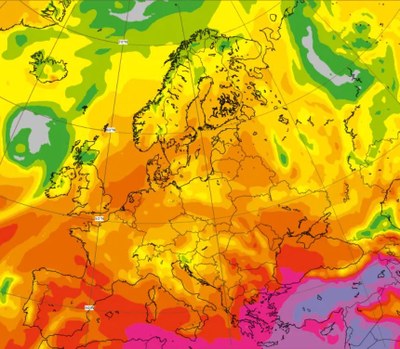
Products from the Copernicus Atmosphere Monitoring Service Forecasting Tools
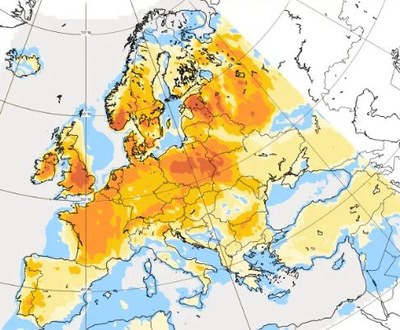
Copernicus Atmosphere Monitoring Service
Copernicus Atmosphere Monitoring Service
Copernicus Atmosphere Monitoring Service
Copernicus Atmosphere Monitoring Service
Copernicus Atmosphere Monitoring Service
Copernicus Atmosphere Monitoring Service
Explore more data

European Environment Agency
Internal Displacement Monitoring Centre
European Environment Agency
European Centre for Disease Control
Language preference detected
Do you want to see the page translated into ?
Exclusion of liability
This translation is generated by eTranslation, a machine translation tool provided by the European Commission.
Exclusion of liability
This translation is generated by eTranslation, a machine translation tool provided by the European Commission.