Home Database Case studies Adapting to heat stress in Antwerp (Belgium) based on detailed thermal mapping The average urban heat island intensity (in °C) in Antwerp for the period 2008-2017
Website experience degraded
The European Climate and Health Observatory is undergoing reconstruction until June 2024 to improve its performance. We apologise for any possible disturbance to the content and functionality of the platform.

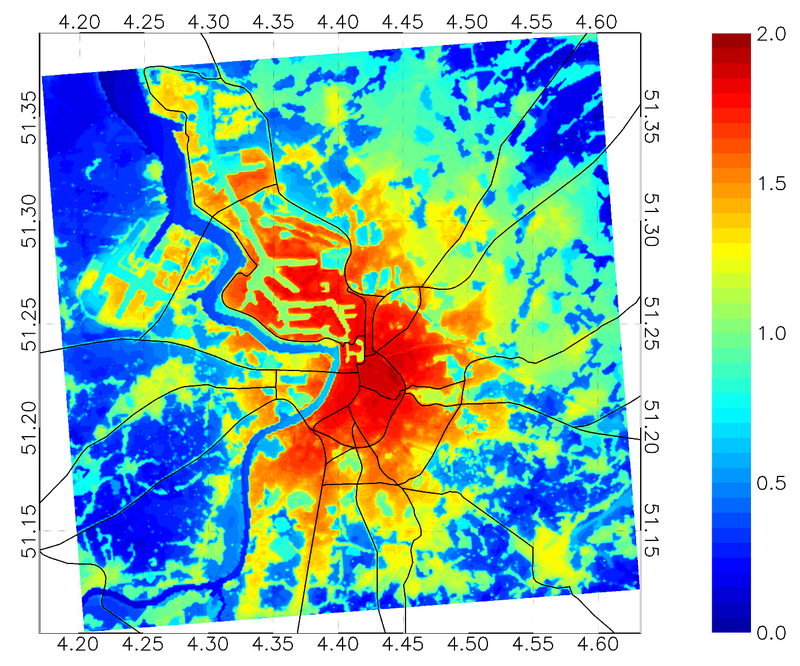
The average urban heat island intensity (in °C) in Antwerp for the period 2008-2017

This map shows the result of VITO’s urban climate UrbClim model for the city of Antwerp and its surroundings. The basis data are hourly 2m air temperature values with a horizontal resolution of 100m. Author: Dirk Lauwaet (VITO). Source: Copernicus Health project (https://climate.copernicus.eu/european-health-service.