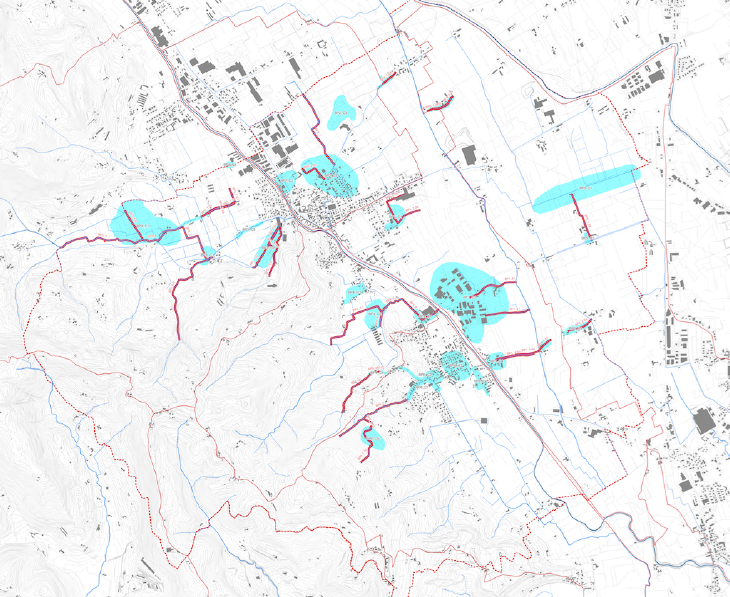
Historical flood map (2000-2015)
Flood-prone areas (historically flooded) as recognized by the citizens during the public meetings; waterways causing the flooding issues are highlighted in red. Source and author: Green-Dev datasets – Isola Vicentina MWMP (Tav.17).

